You Built a Well-Designed System… But Will It Survive a Million Requests?
You’ve built an application with solid system design.
Clean architecture. Async APIs. A scalable database. Caching in place.
Everything looks perfect on paper.
But there’s one uncomfortable question most developers avoid:
What actually happens when traffic explodes?
What if tomorrow your API receives 100k, 500k, or even 1 million requests?
Good design does not automatically mean good performance.
That’s where load testing comes in.
In this post, we’ll walk through how to load test a FastAPI application using Apache JMeter, and more importantly, how to interpret the results in a production-oriented way.
Why Load Testing Matters (Even for “Well-Designed” Systems)
FastAPI is fast — but that doesn’t make it immune to real-world constraints.
Things that commonly break under load:
- Async code that still blocks the event loop
- Database connection pool exhaustion
- CPU and memory limits
- Network latency compounding under concurrency
Without load testing, you’re guessing.
Load testing answers questions like:
- How many requests per second can my API actually handle?
- Where does it break first — CPU, database, memory, or network?
- Does latency degrade gradually or collapse suddenly?
- Will autoscaling help, or just hide the problem?
Why Apache JMeter?
Apache JMeter is not trendy, but it is brutally effective.
- Open source
- Battle-tested
- Capable of simulating millions of requests
- Supports HTTP, WebSocket, TCP, and more
It doesn’t care how elegant your architecture is. It only cares whether your system survives.
That’s exactly what you want.
Sample FastAPI Endpoint
Assume a simple FastAPI endpoint:
from fastapi import FastAPI
import asyncio

app = FastAPI()

@app.get("/health")
async def health_check():
    await asyncio.sleep(0.01)
    return {"status": "ok"}
This endpoint is:
- Async
- Lightweight
- No database
- No external calls
If anything should survive load testing, this should.
That makes it a perfect baseline.
Setting Up JMeter for FastAPI
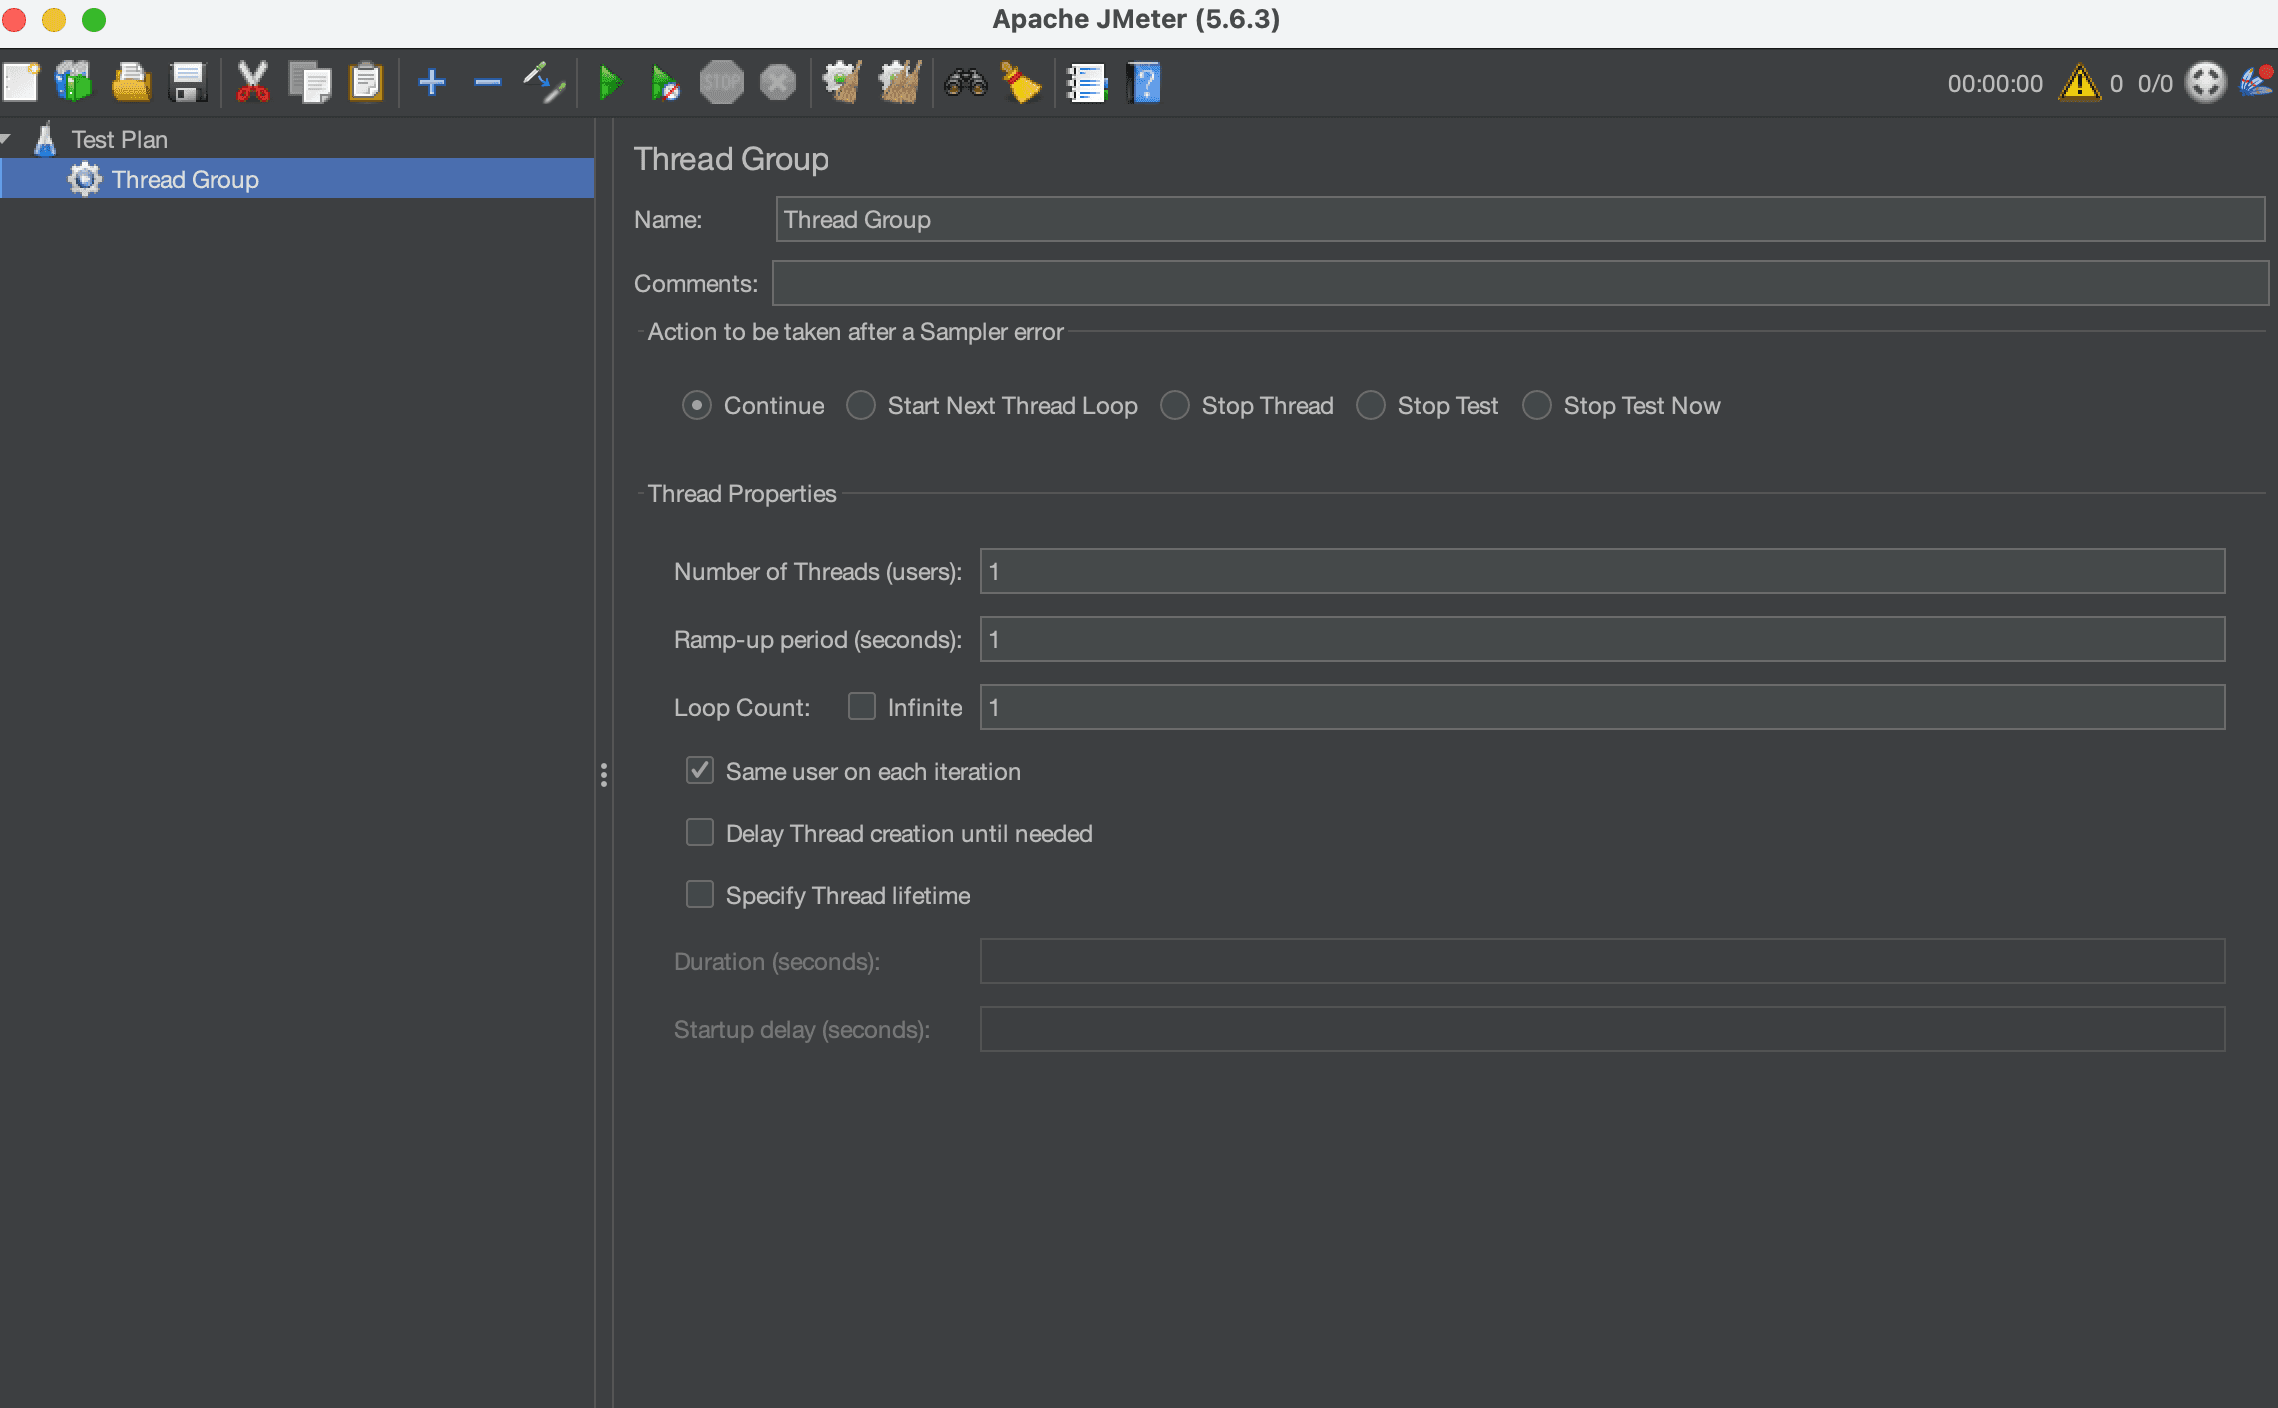
1. Create a Thread Group
In JMeter, configure a Thread Group with:
- Threads (Users): 10,000
- Ramp-Up Period: 100 seconds
- Loop Count: 100
What this means in practice:
10,000 users × 100 requests = 1,000,000 requests
Already, this is far beyond what most teams ever test.
2. Add an HTTP Request Sampler
Configure the HTTP Request:
- Method: GET
- Server Name: localhost
- Port: 8000
- Path: /health
This simulates real HTTP traffic hitting your FastAPI service.
3. Add Listeners (Carefully)
Listeners consume memory. Under high load, they can crash JMeter before your app fails.
For large tests:
- Avoid: View Results Tree
- Prefer: Summary Report or Backend Listener
If JMeter dies first, your test is meaningless.
Running the Test (CLI Mode Only)
Never run million-request tests in the JMeter GUI.
Use CLI mode instead:
jmeter -n \
    -t fastapi_test.jmx \
    -l results.jtl \
    -e -o report/
This produces:
- Raw results (.jtl)
- An HTML performance report
- Aggregate metrics you can actually trust
What Metrics Actually Matter
Big numbers can be intimidating. Focus on the right ones.
1. Throughput
Requests per second your API sustains under load.
This is your real capacity.
2. Latency Percentiles
Ignore average latency.
Look at:
- P50 (median)
- P95
- P99
P99 is where users feel pain.
Average latency hides disasters.
3. Error Rate
Even a tiny error rate matters at scale.
0.1% errors at 1,000,000 requests = 1,000 failed requests
That’s not “basically fine” in production.
4. Resource Usage
While the test runs, monitor:
- CPU usage
- Memory consumption
- Open file descriptors
- Database connections
Metrics without system context are useless.
Common FastAPI Bottlenecks You’ll Discover
Load testing almost always exposes at least one of these.
Blocking Code Inside Async Endpoints
time.sleep(1) # silent killer
One blocking call can freeze thousands of concurrent requests.
Database Connection Pool Exhaustion
Default database pools are small.
Async code doesn’t save you if all connections are busy.
Logging Overhead
Excessive logging turns into an I/O bottleneck fast.
Especially under high request volume.
JSON Serialization Cost
Large responses cost CPU.
You’ll feel it at scale.
Can FastAPI Handle a Million Requests?
Short answer: Yes — with the right setup.
But not:
- On a single worker
- With default configurations
- Without tuning
- Without testing
In real systems, you’ll need:
- Multiple Uvicorn workers
- Proper database pooling
- Caching (Redis or similar)
- Horizontal scaling
- A load balancer
Most importantly, you need evidence, not assumptions.
The Real Lesson
System design interviews love diagrams.
Production systems love numbers.
Until you load test:
- You don’t know your limits
- You don’t know your bottlenecks
- You don’t know your failure mode
JMeter doesn’t care about clean architecture.
It asks one question:
Can you survive this traffic?
Final Thoughts
If you’re building APIs with FastAPI and planning for scale:
- Don’t wait for users to test your system
- Don’t trust intuition
- Don’t assume async equals infinite scalability
Break your system on purpose. Fix it. Then ship with confidence.
Load testing is not optional. It’s part of engineering.
Get more dev insights
Join other developers getting community updates, new articles, and real-world learnings. No spam.
Written by
TermTrix
Building learning-driven tech communities at TermTrix. Writing about modern web development, system design, and developer tooling.

